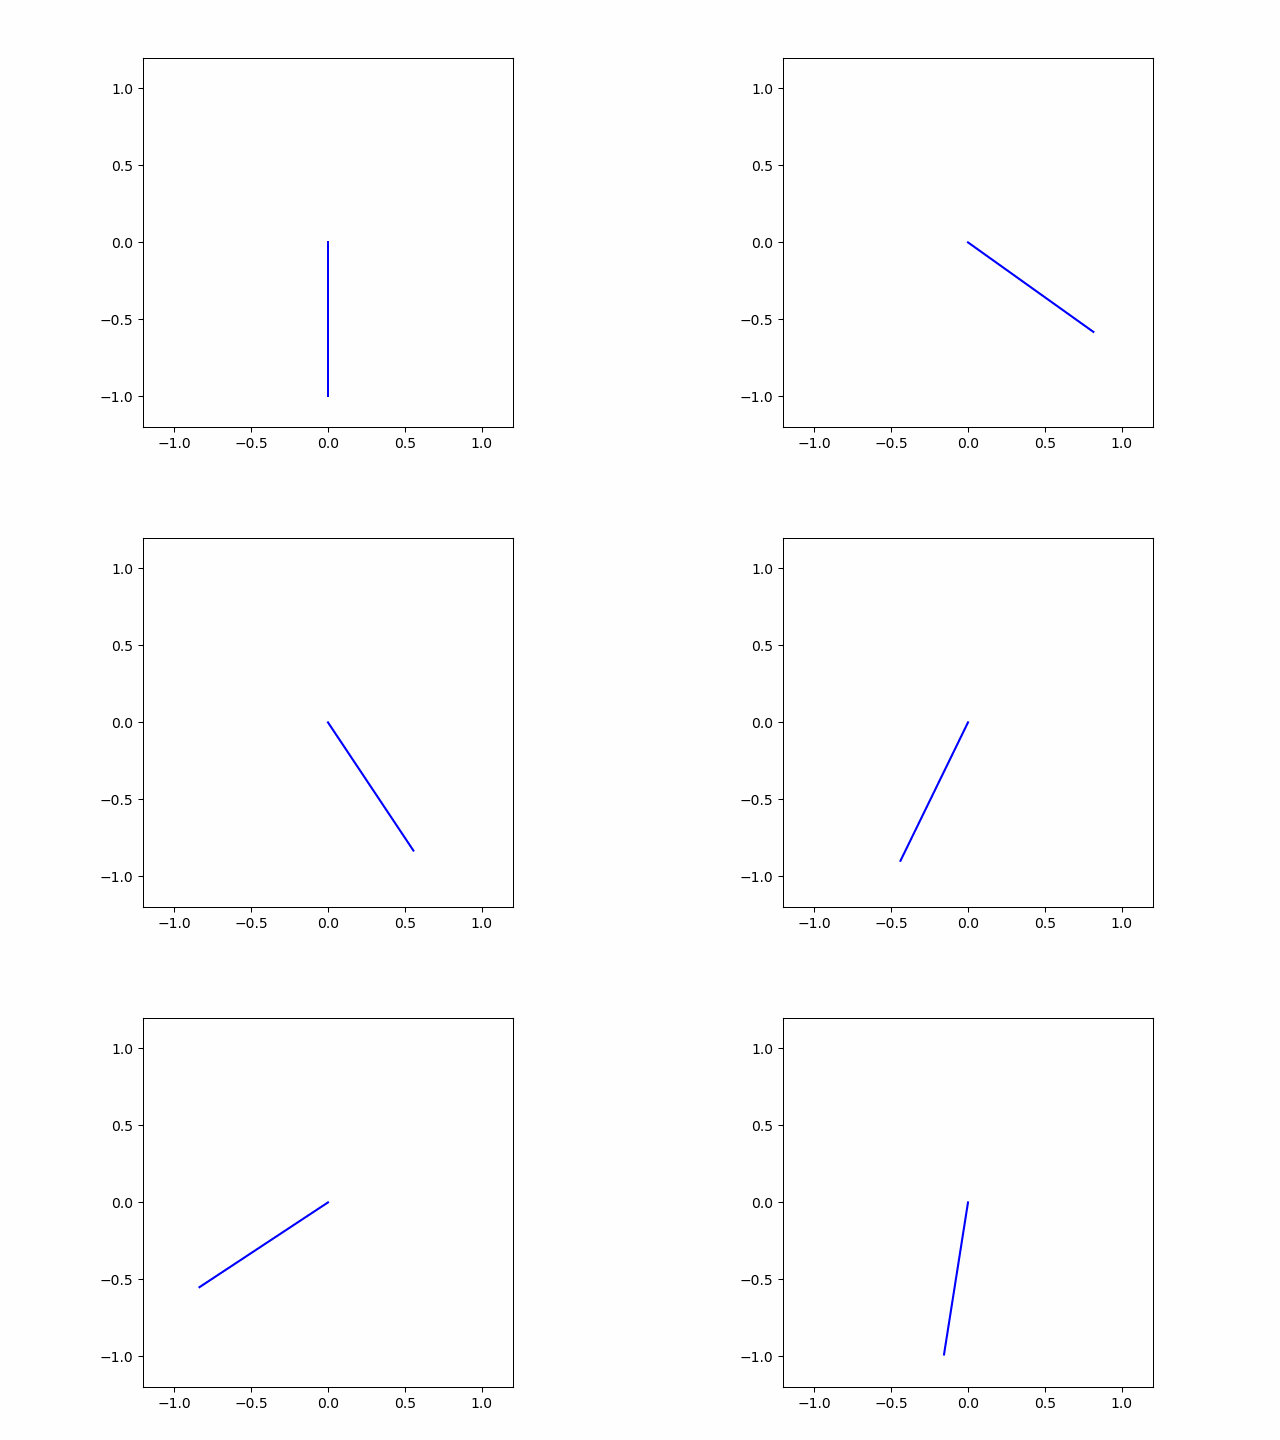


Animation#
Animation is a great way to visualize dynamic data.
A basic way is to draw an image, pause a while for viewing, erase it, and then draw the next image.
import numpy as np
import matplotlib.pyplot as plt
%matplotlib widget
For animation in the Jupyter notebook, we can use IPython.display
from IPython.display import display
# Swinging pendulum
l = 1  # arm length
fig = plt.figure()  # prepare a figure
for t in np.arange(0, 1, 0.02):  # 1 cycle
    th = np.sin(2*np.pi*t)  # angle
    x = np.sin(th)   # horizontal position of tip
    y = -np.cos(th)  # vertical position of tip
    # make a new plot
    plt.plot([0, x], [0, y], 'b-o')
    plt.axis('square')
    plt.xlim(-1.2*l, 1.2*l)
    plt.ylim(-1.2*l, 1.2*l)
    display(fig, clear=True)
    plt.pause(0.02);
    plt.clf()  # clear the figure
Animation tools of Matpltlib#
You can use animation class of matplotlib to store an array of frames and then show them for viewing or save them in a movie file.
from matplotlib import animation
l = 1  # arm length
fig = plt.figure()
frames = []  # prepare frames
for t in np.arange(0, 1, 0.02):  # 1 cycle
    th = np.sin(2*np.pi*t)  # angle
    x = np.sin(th)   # horizontal position of tip
    y = -np.cos(th)  # vertical position of tip
    # make a new plot
    pl = plt.plot([0, x], [0, y], 'b-o')
    plt.axis('square')
    plt.xlim(-1.2*l, 1.2*l)
    plt.ylim(-1.2*l, 1.2*l)
    frames.append(pl)
# show the frames as animation
anim = animation.ArtistAnimation(fig, frames, interval=20, repeat=True)
You can save the movie in a motion gif file.
anim.save("pend.gif", writer='pillow')
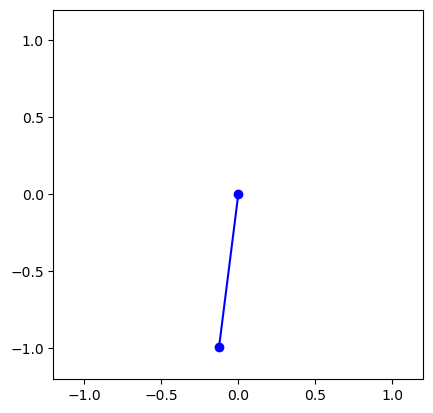
Here is the saved file pend.gif: