6. Ordinary Differential Equations: Exercise#
Name:
Date:
import numpy as np
import matplotlib.pyplot as plt
%matplotlib inline
from scipy.integrate import odeint
1. Linear ODEs#
Like the exponential of a real number \(x\) is given by
the exponential of a matrix \(X\) is defined as
For one dimensional linear ODE
the solution is given by
where \(y(0)\) is the initial state.
For an \(n\) dimensional linear ODE
where \(A\) is an \(n\times n\) matrix, the solution is given by the matrix exponential
where \(y(0)\) is an \(n\)-dimensional initial state.
Verify this by expanding \(e^{At}\) accordint to the definition and differentiating each term by \(t\).
The behavior of the matrix exponentioal \(e^{At}\) depends on the eivenvalues of \(A\); whether the eigenvalues are real or complex, and whether the real part is positive or negative.
Let us visualize solutions for different eigenvalues.
def linear(y, t, A):
    """Linear dynamcal system dy/dt = Ay
    y: n-dimensional state vector
    t: time (not used, for compatibility with odeint())
    A: n*n matrix"""
    # y is an array (row vector), A is a matrix
    return A@y
def linear2D(A, yinit=np.array([[1,0],[0,1],[-1,0],[0,-1]]), t=np.arange(0, 5, 0.1)):
    """Visualizing linear 2D dynamical system"""
    for y0 in yinit:
        y = odeint(linear, y0, t, args=(A,))
        plt.plot(y[0,0], y[0,1], 'o')   # starting point
        plt.plot(y[:,0], y[:,1], '+-')  # trajectory
    plt.axis('equal')
    return np.linalg.eig(A)
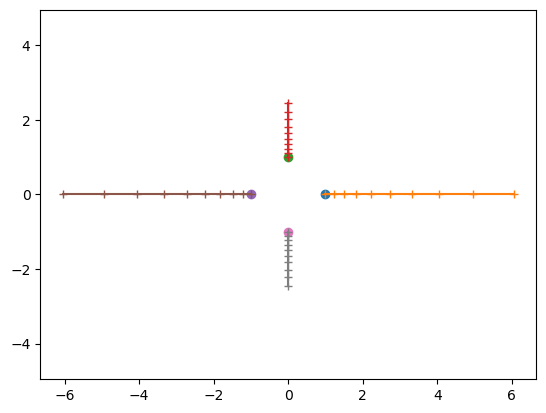
Real eigenvalues \(\lambda_1 > \lambda_2 > 0\)
A = np.array([[2, 0], [0, 1]])  # modify this!
linear2D(A, t=np.arange(0, 1, 0.1))
EigResult(eigenvalues=array([2., 1.]), eigenvectors=array([[1., 0.],
       [0., 1.]]))
Real eigenvalues \(\lambda_1 > 0 > \lambda_2\)
Real eigenvalues \(0 > \lambda_1 > \lambda_2\)
Complex eigenvalues \(\lambda_1=a+ib\) and \(\lambda_2=a-ib\) with \(a>0\)
Complex eigenvalues \(\lambda_1=a+ib\) and \(\lambda_2=a-ib\) with \(a<0\)
c.f. For a 2 by 2 matrix
we can analytically derive the eivenvalues from
as
2. Nonlinear ODEs#
Implement a nonlinear system, such as a pendulum with friction \(\mu\):
def pendulum(y, t, m=1, l=1, mu=1, g=9.8):
    """pendulum dynamics
    m:mass, l:length, mu:damping, g:gravity"""
Run a simulation by
odeint()and show the trajectory as (t, y(t))
Show the trajectory in the 2D state space \((\theta, \omega)\)
Option) Implement a nonlinear system with time-dependent input, such as a forced pendulum:
and see how the behavior changes with the input.
3. Bifurcation#
FitzHugh-Nagumo model is an extension of Van der Pol model to approximate spiking behaviors of neurons.
Implement a function and see how the behaviors at different input current \(I\).
def fhn(y, t, I=0, a=0.7, b=0.8, phi=0.08):
    """FitzHugh-Nagumo model"""
    v, w = y
y0 = np.array([0, 0])
t = np.arange(0, 100, 0.1)
y = odeint(fhn, ...
  Cell In[7], line 3
    y = odeint(fhn, ...
                       ^
_IncompleteInputError: incomplete input
plt.plot(y[:,0], y[:,1], '+-') # phase plot
Draw a bifurcation diagram showing the max-min of \(v\) for different values of \(I\).