Takes a GBreaks object and prepares an Oxford (macrosynteny) of the
coordinates of the query ranges against the target ranges after
concatenating them.
Arguments
- gb
A
GBreaksobject- sp1Name
Name of the first species (default: sp1)
- sp2Name
Name of the second species (default: sp2)
- sp1ChrArms
A
GBreaksobject of chromosome arms in sp1 genome- sp2ChrArms
A
GBreaksobject of chromosome arms in sp2 genome- type
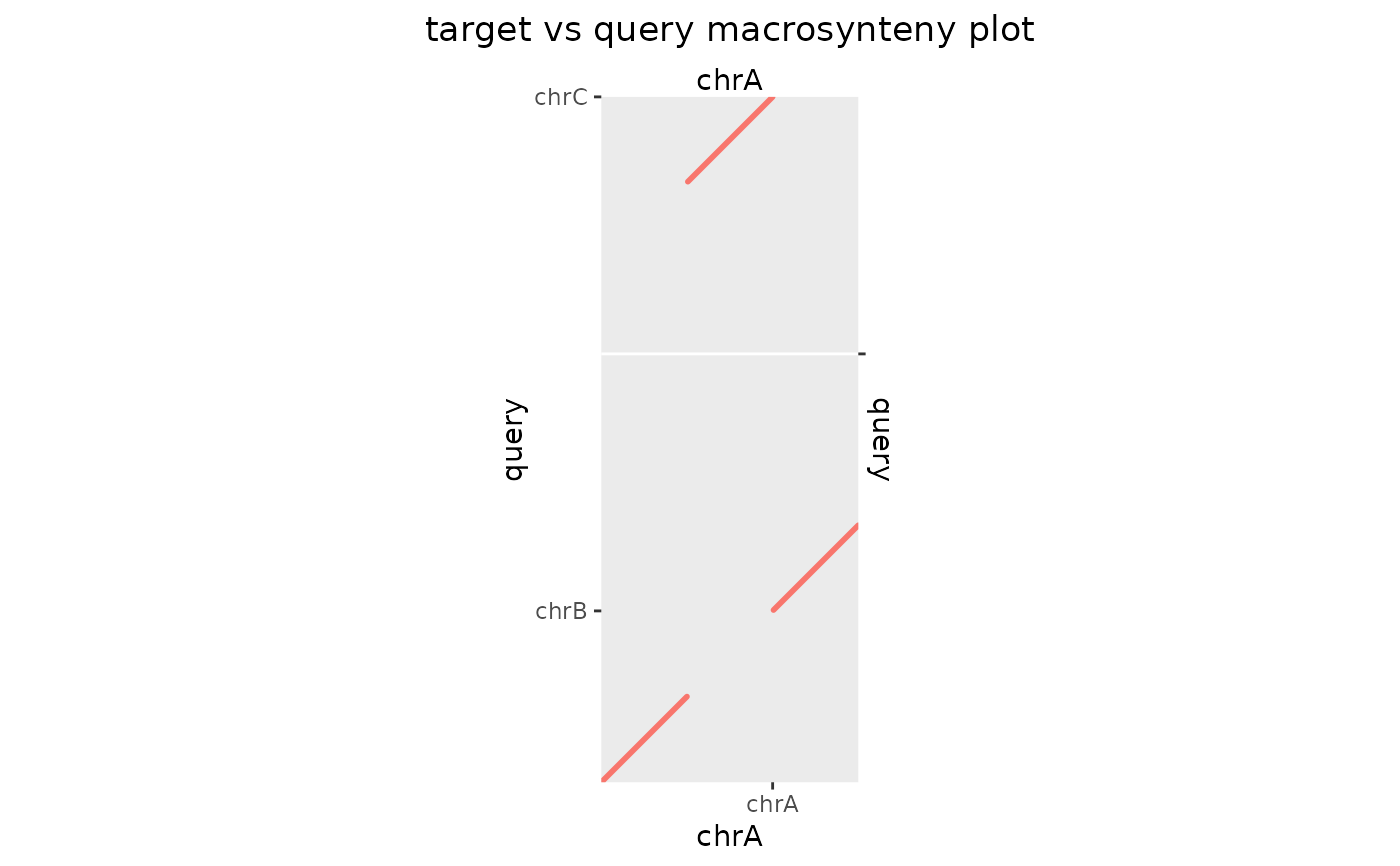
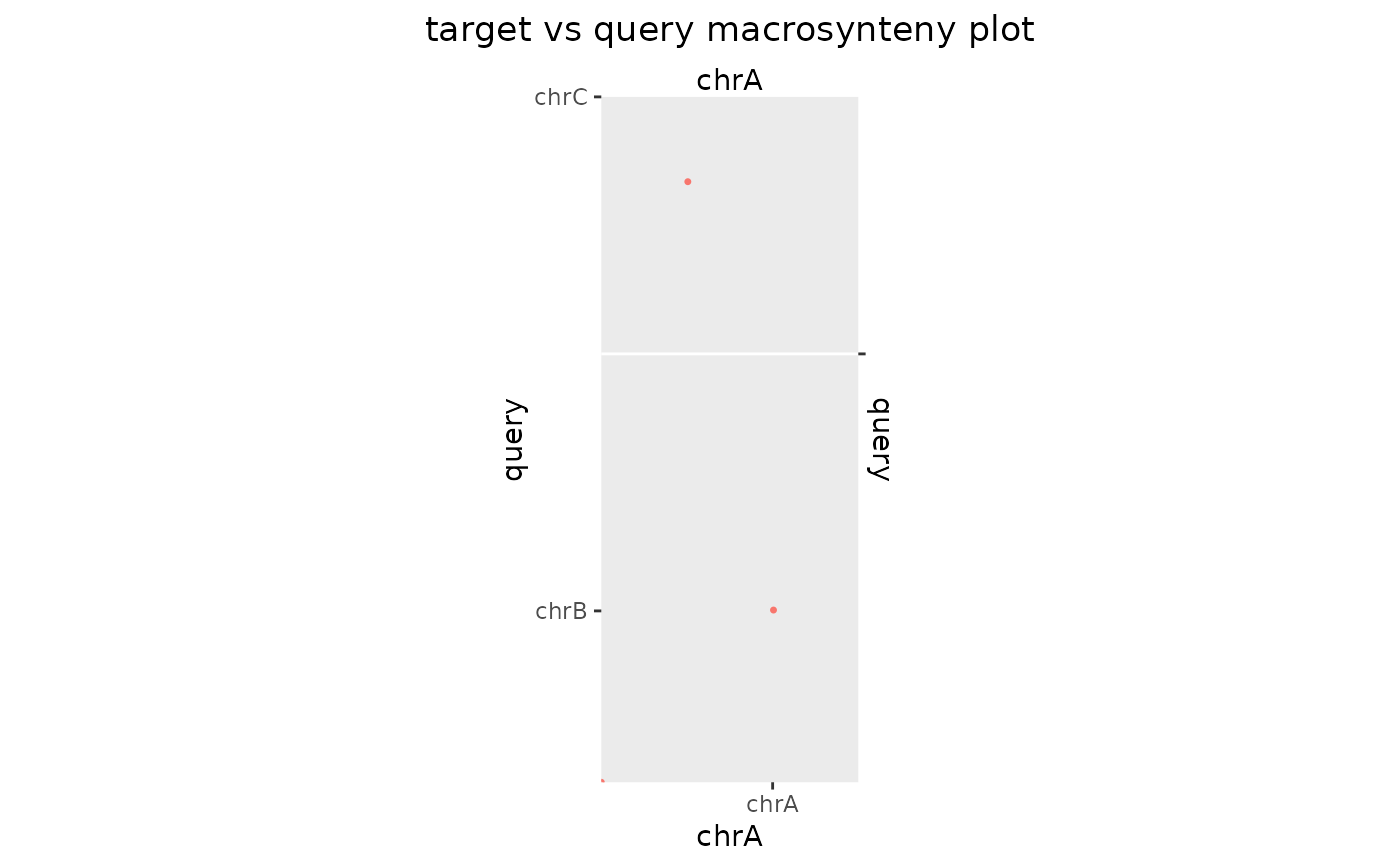
The type of the plot (
point,lineornone)- size
The size of the plotted dots or segments.
- diag
Diagonalise the plot by reordering query sequence levels.
- col
Colour of the plotted dots or lines by
seqnames,strandorscore.
Value
Returns a ggplot2 object that can be further modified using the
+ operator. Use type = 'none' to receive an object without geom
layer.
See also
Other plot functions:
bp_heatmap(),
bp_pair_analysis(),
feature_coverage(),
plotApairOfChrs()